Introduction: Interpreting a Turning Point in UK Trade
The latest data release from the Office for National Statistics (ONS), UK Trade: September 2025, offers a revealing snapshot of the nation’s external performance. It measures the total value of UK exports and imports of goods and services—both in current prices and in inflation-adjusted “chained volume” terms. The September bulletin shows a decline in both export and import flows, with the goods trade deficit widening and services providing only partial offset.
For observers of global trade, these results arrive at a critical juncture. Customs modernization, automation, and digital declarations—such as CDS declarations and ENS declarations—are reshaping how data are captured and processed. Understanding how these macro indicators link to everyday trade operations is crucial for UK businesses navigating a slower world economy and increasingly complex compliance environment.
Headline Figures: A Widening Goods Deficit
Goods Trade in Current Prices
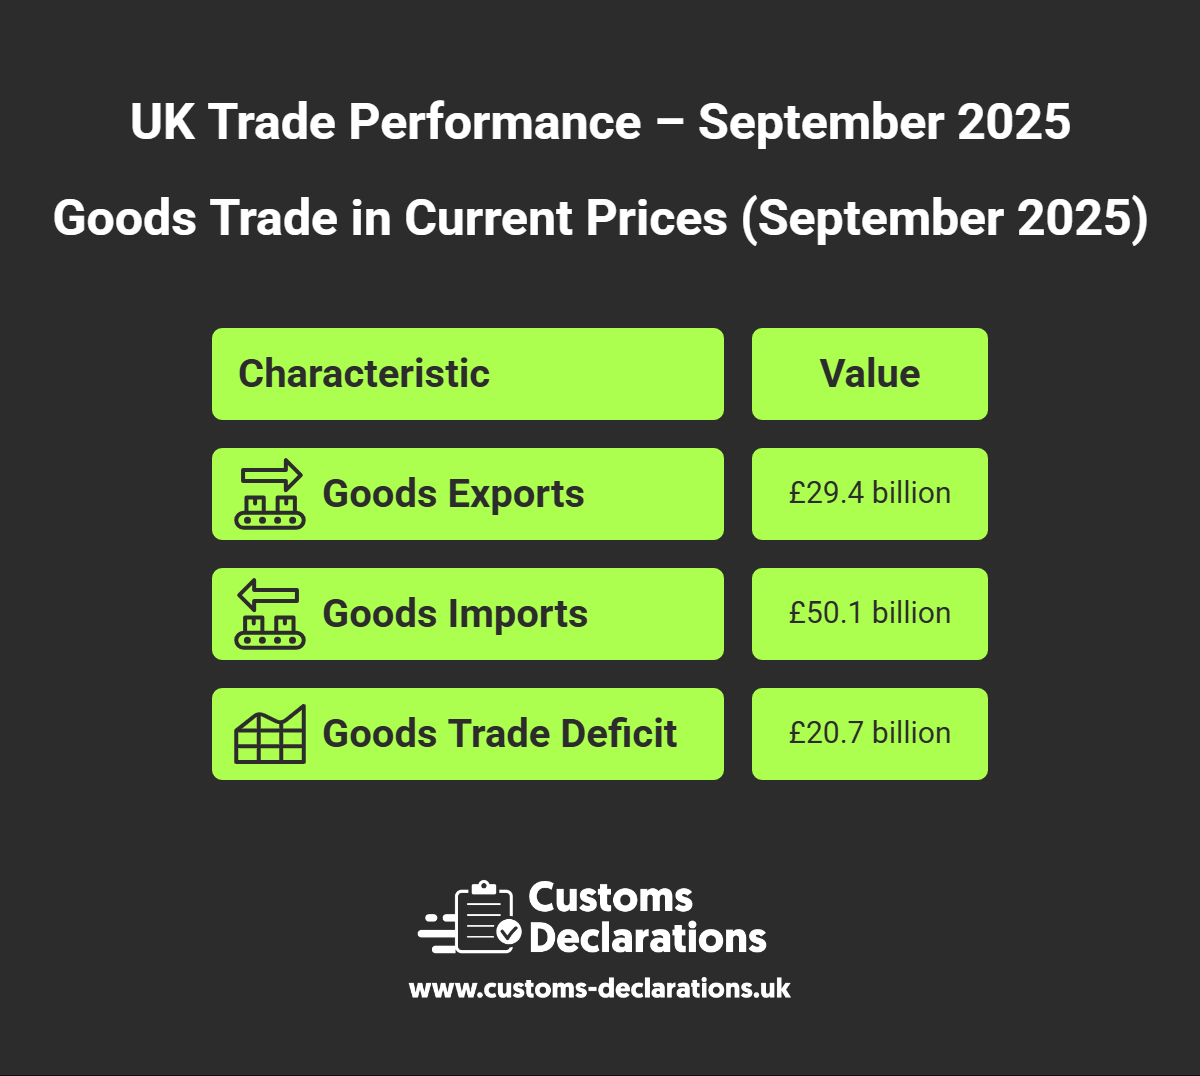
- Goods exports fell by £1.7 billion (-5.5%) to approximately £29.4 billion in September 2025.
- Goods imports declined by £1.0 billion (-2.0%) to about £50.1 billion.
- The resulting goods trade deficit (excluding precious metals) stood at roughly £20.7 billion.
Imports from the EU dropped by £0.9 billion (-3.3%), led by lower purchases of machinery, chemicals, and fuels. Imports from non-EU partners fell marginally by £0.1 billion (-0.5%), reflecting lower crude-oil shipments from Kazakhstan, partly offset by increased pharmaceutical imports from the United States and Canada.
Exports mirrored this pattern but with sharper declines—particularly to non-EU destinations, down £1.3 billion (-8.0%), while exports to the EU slipped £0.4 billion (-2.7%).
Inflation-Adjusted (Chained Volume) Measures
When adjusted for price changes, goods imports fell 1.6% and exports 5.1%. The close alignment between nominal and real movements indicates that this is a genuine fall in trade volumes, not merely an effect of lower prices. Demand itself weakened.
The Services Sector: Stable but Softening
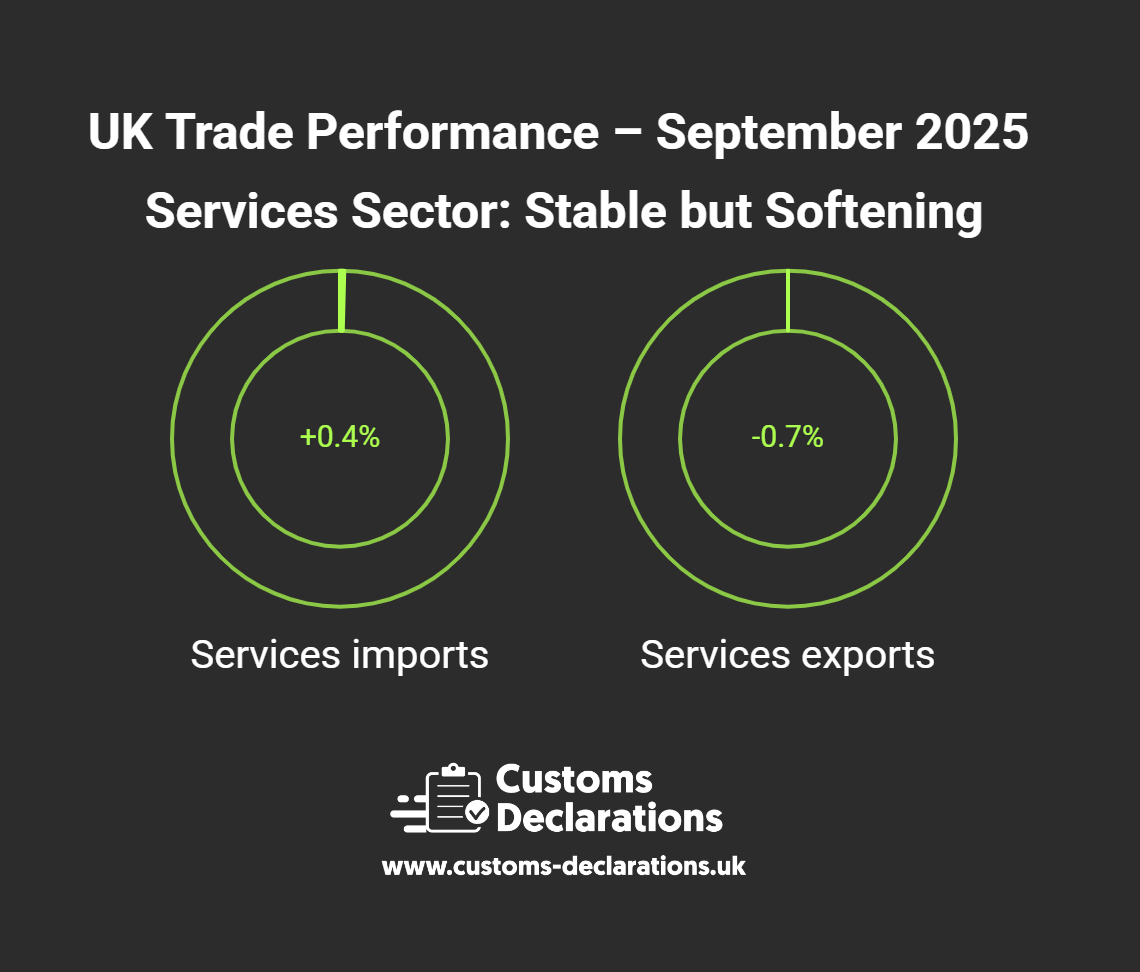
Services remain the cornerstone of the UK’s trade surplus. However, September 2025 showed mild contraction:
- Services exports fell by £0.3 billion (-0.7%).
- Services imports rose £0.1 billion (+0.4%).
Business surveys, including the S&P Global PMI (index 50.8), confirmed stagnation—only marginal growth and declining export orders, particularly from Europe. The UK’s global leadership in financial, business, and intellectual-property services continues, but momentum has slowed in tandem with subdued demand across major economies.
Regional and Commodity Trends
Trade with the European Union
Exports to the EU totaled £14.4 billion, while imports reached £26.5 billion, maintaining the EU as the UK’s largest goods-trading partner.
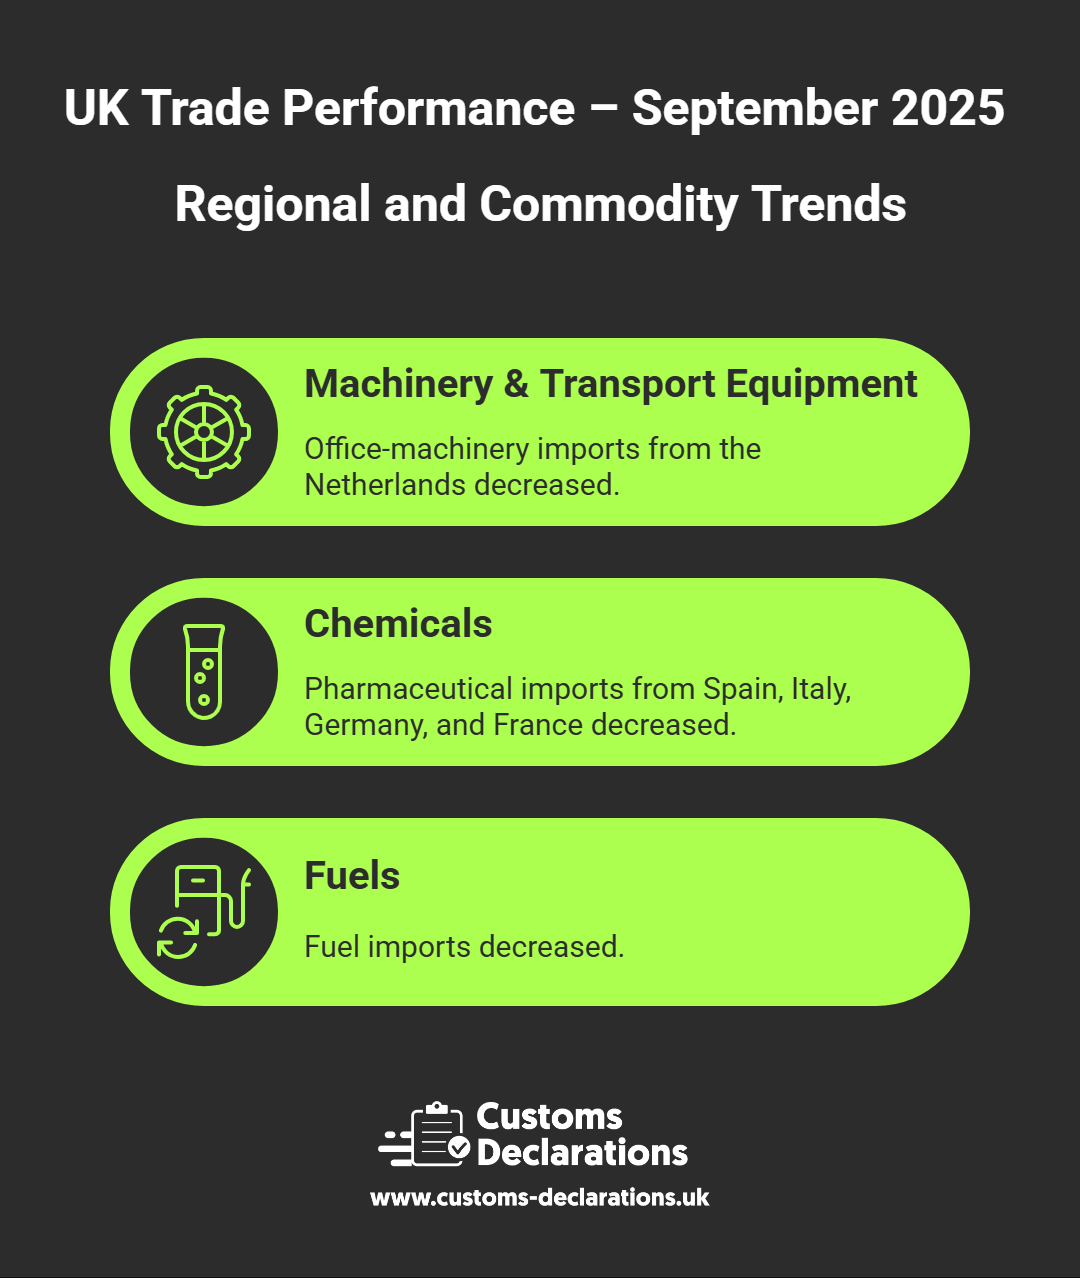
Declines were concentrated in:
- Machinery & Transport Equipment (-£0.7 billion) – notably office-machinery imports from the Netherlands.
- Chemicals (-£0.3 billion) – lower pharmaceutical imports from Spain, Italy, Germany, and France.
- Fuels (-£0.2 billion).
Exports to the bloc slipped primarily because of lower crude-oil sales to Poland, Denmark, and Germany.
Trade with Non-EU Countries
Exports to non-EU markets declined steeply, down £1.3 billion (-8.0%), largely in machinery and transport equipment, including cars to China and the United States. Imports from non-EU partners remained broadly stable, showing a small rise in chemical products.
The Automotive Sector: A Perfect Storm
No industry illustrated the September downturn more vividly than automotive manufacturing. Car exports plunged 24.5%, according to the Society of Motor Manufacturers and Traders (SMMT). The immediate cause was a cyber-incident at a major UK producer, halting production and shipments to both the US and China.
Yet deeper structural pressures were also evident—transition costs toward electric vehicles, high input prices, and growing competition from Asian manufacturers. Given that motor vehicles form a major share of UK goods exports, this episode significantly distorted national trade statistics.
The United States: A Strained Relationship
The United States, historically one of Britain’s top export destinations, accounted for roughly 11% of total goods exports, down from 14% a month earlier. Exports of goods to the US fell £0.5 billion (-11.4%), reaching their lowest level since January 2022.
The drop spanned chemicals (-£0.3 billion, mainly inorganic compounds) and machinery (-£0.1 billion, primarily vehicles). In contrast, imports from the US rose £0.2 billion (+5.3%), driven by fuels and chemicals.
Approximately one-third of UK exporting firms reported being affected by US tariffs, and 22% cited higher costs as the most significant impact. This asymmetry—UK exports down while US imports rise—highlights competitiveness challenges and the effect of differing regulatory and cost structures.
Quarterly Overview: July–September 2025
Looking at the third quarter smooths out monthly volatility:
- Total goods and services deficit widened by £2.8 billion to £5.6 billion.
- Goods deficit alone reached £59.6 billion, up £3.0 billion from the prior quarter.
- Services surplus grew slightly to £54.0 billion, offsetting part of the goods gap.
Quarterly Import Composition
Imports rose 1.5% (q-o-q), with increases in:
- Machinery and transport equipment (+£0.5 billion), including aircraft from Germany.
- Food and live animals (+£0.4 billion), notably coffee and tea from the Netherlands and Poland.
- Miscellaneous manufactures (+£0.2 billion).
Chemical imports fell £0.3 billion, but overall trends indicate steady domestic demand despite broader economic headwinds.
Quarterly Export Composition
Exports decreased 0.7%, mainly because of weaker non-EU performance (-1.5%).
- Non-EU declines: machinery and transport (-£0.6 billion) and chemicals (-£0.3 billion).
- Offsetting gains: material manufactures (+£0.5 billion).
Crude-oil exports to Germany and Poland rose, while pharmaceutical shipments to Belgium and Ireland fell.
Price Dynamics: Understanding the Implied Deflators
The implied deflators—ratios of nominal to real trade values—remained relatively stable. For goods, nominal exports fell 5.5% while real exports fell 5.1%; imports fell 2.0% vs 1.6% in volume. This suggests limited trade-price inflation, consistent with moderated global energy and commodity prices in late 2025.
Stable deflators imply that customs valuations for import declarations and export declarations were not heavily affected by inflationary adjustments during this period—helpful for traders managing pricing and duty exposure through platforms like Customs Declarations UK.
Data Integrity and Structural Considerations
Fuel-Export Data Error
HMRC identified a data error affecting fuel export records since March 2024, under-reporting by roughly 1.3% of 2024 goods exports and 2.1% of 2025 goods exports. Once corrected, the overall trade deficit will likely narrow modestly. The ONS plans revisions in December 2025.
Precious-Metals Methodology Changes
Adjustments in how non-monetary gold and other metals are captured have removed double-counting and improved historical accuracy back to 1997. However, such revisions can cause temporary volatility in monthly aggregates.
Brexit-Related Structural Breaks
Post-January 2021, new customs reporting requirements for EU trade introduced structural breaks in long-term series. Businesses filing CDS declarations for EU trade have become key data contributors, but direct comparison with pre-Brexit figures must be treated with caution.
Policy Context: Global Customs Modernization
The UK’s trade data cannot be interpreted in isolation from worldwide efforts to modernize customs systems. Governments are increasingly adopting digital declaration platforms, automated risk analysis, and real-time data exchange to enhance border efficiency.
In this context, platforms like Customs Declarations UK exemplify the private-sector drive toward modernization—enabling traders to self-submit compliant import, export, and ENS filings without relying solely on traditional brokers. As trade volumes fluctuate, automation and data quality become decisive advantages.
For policymakers, the September figures highlight how fragile export-driven growth can be without continuous modernization of customs processes, trade facilitation, and digital integration with partner economies.
Interpreting the Broader Economic Picture
Domestic Demand Holds Up
Despite weak exports, the resilience of imports suggests solid domestic consumption and business investment. This is consistent with moderate GDP growth of 0.2% in Q3 2025, as reported by the ONS. However, reliance on imports risks widening external imbalances if exports do not recover.
Global Conditions and Exchange Rates
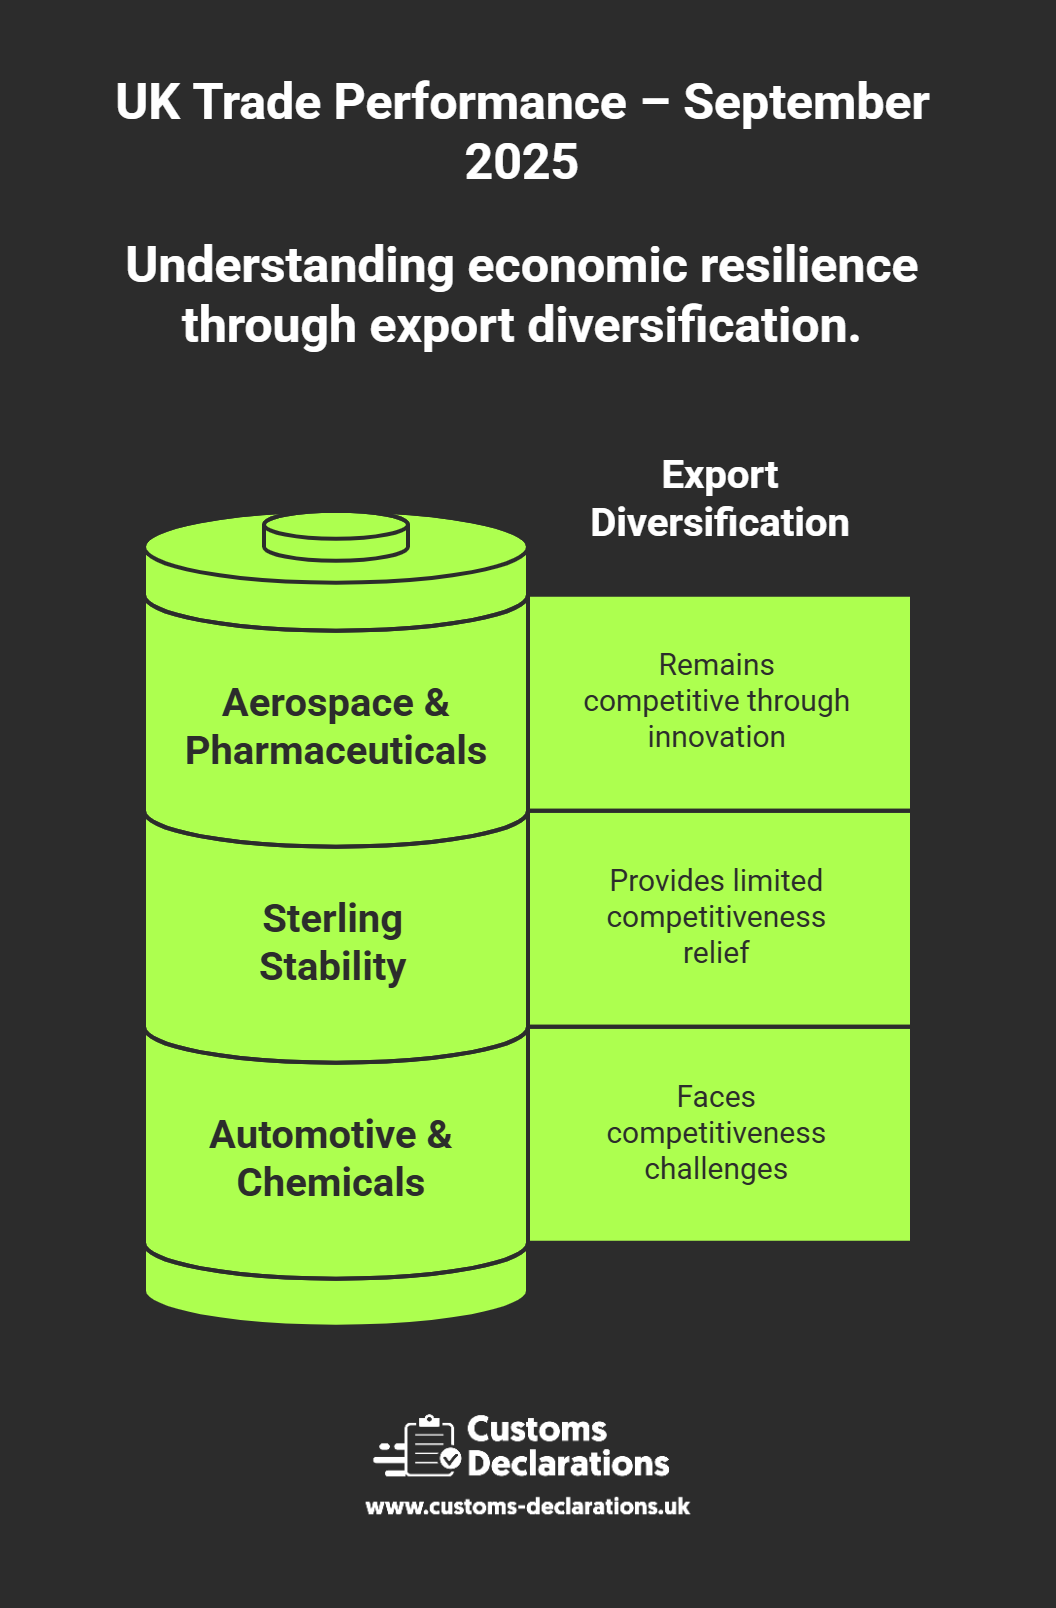
Slowing growth in China and the EU, coupled with ongoing US tariffs, has dampened global demand. Sterling’s relative stability in mid-2025 provided limited competitiveness relief—helping keep import prices contained but offering little boost to exporters.
Industrial and Sectoral Resilience
Beyond automotive and chemicals, UK manufacturers of aerospace components and pharmaceuticals remain competitive, supported by innovation and diversified supply chains. Nevertheless, the September data underline the need for export diversification, both geographically and by sector.
Strategic Takeaways for Businesses
- Invest in digital customs compliance. Automated solutions for CDS and ENS declarations reduce delays and errors—critical when profit margins are pressured by falling volumes.
- Diversify markets. Overreliance on traditional partners like the EU and US exposes exporters to concentrated risks. Expanding into Asia-Pacific or emerging markets may offset Western slowdowns.
- Strengthen supply-chain resilience. The fluctuations in chemical and fuel imports reveal how sudden disruptions affect production. Multi-sourcing and near-shoring should remain priorities.
Monitor sector-specific policies. Automotive, pharmaceuticals, and energy each face distinct regulatory and trade-policy trajectories that directly influence export potential
Conclusion: A Call for Adaptation and Efficiency
The September 2025 trade figures depict an economy in adjustment—exports contracting faster than imports, industrial sectors under strain, and services only partially cushioning the impact. The numbers point to genuine volume declines rather than temporary price distortions, signaling weaker global demand and supply-side constraints.
However, the UK retains substantial strengths: an innovative services base, a dynamic SME sector, and advanced customs infrastructure poised for modernization. By embracing digital trade facilitation, improving export competitiveness, and diversifying markets, businesses can navigate the turbulence ahead.
Ultimately, customs modernization is more than a bureaucratic upgrade—it is a strategic necessity for sustaining the UK’s role in global trade.